
Introduction
Candlestick patterns are a cornerstone of technical analysis in trading, offering a visual representation of market sentiment and price action. Originating in Japan over two centuries ago, these patterns have gained global recognition for their effectiveness in predicting market movements. This comprehensive guide aims to explore the intricacies of candlestick patterns, their types, and their application in trading strategies.
What are Candlestick Patterns?
Candlestick patterns are graphical representations of price movements in a trading chart. Each candlestick provides four key pieces of information: the opening price, the closing price, the highest price, and the lowest price over a specific time period. The main body (or the ‘real body’) of the candlestick shows the opening and closing prices, while the lines (or ‘wicks’) above and below represent the high and low prices.
Candlesticks are colored to reflect market dynamics: a green (or white) candlestick indicates that the closing price was higher than the opening price, signaling buying pressure. Conversely, a red (or black) candlestick shows that the closing price was lower than the opening price, indicating selling pressure.
Types of Candlestick Patterns
Candlestick patterns come in various forms, each providing insights into market psychology and potential price movements. They are generally classified into three categories: bullish patterns, bearish patterns, and continuation patterns. (View the Complete List Here)
Bullish Patterns:
These patterns signal a potential upward movement in prices. Key bullish patterns include:
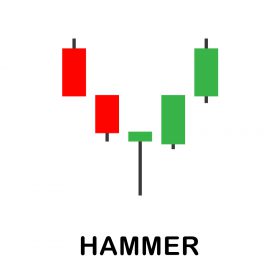
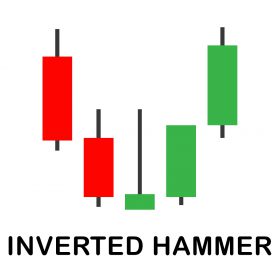
- Hammer and Inverted Hammer: Indicating a reversal of a downtrend, these patterns have a small body and a long lower wick.
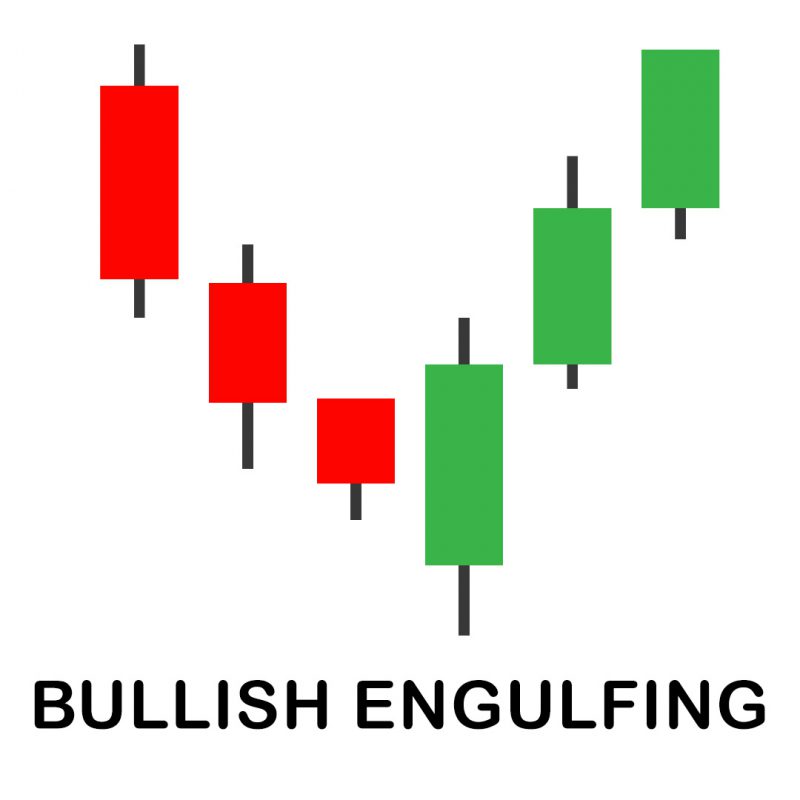
- Bullish Engulfing: A large green candlestick engulfing a smaller red one, suggesting a shift from bearish to bullish sentiment.
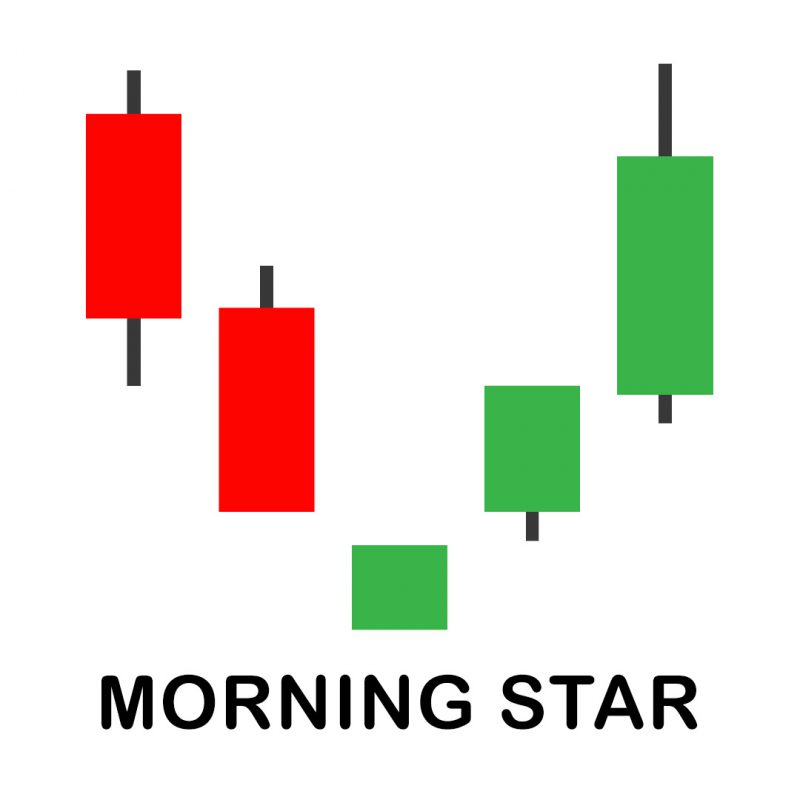
- Morning Star: A three-candle pattern indicating a bullish reversal, typically appearing at the end of a downtrend.
Bearish Patterns:
These suggest a potential decline in prices. Important bearish patterns are:
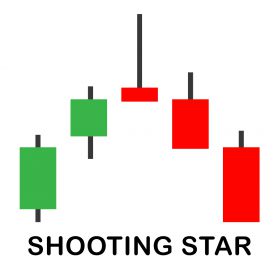
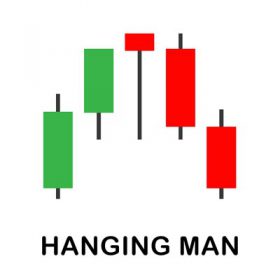
- Shooting Star and Hanging Man: Characterized by a small body and a long upper wick, these patterns signal a bearish reversal.
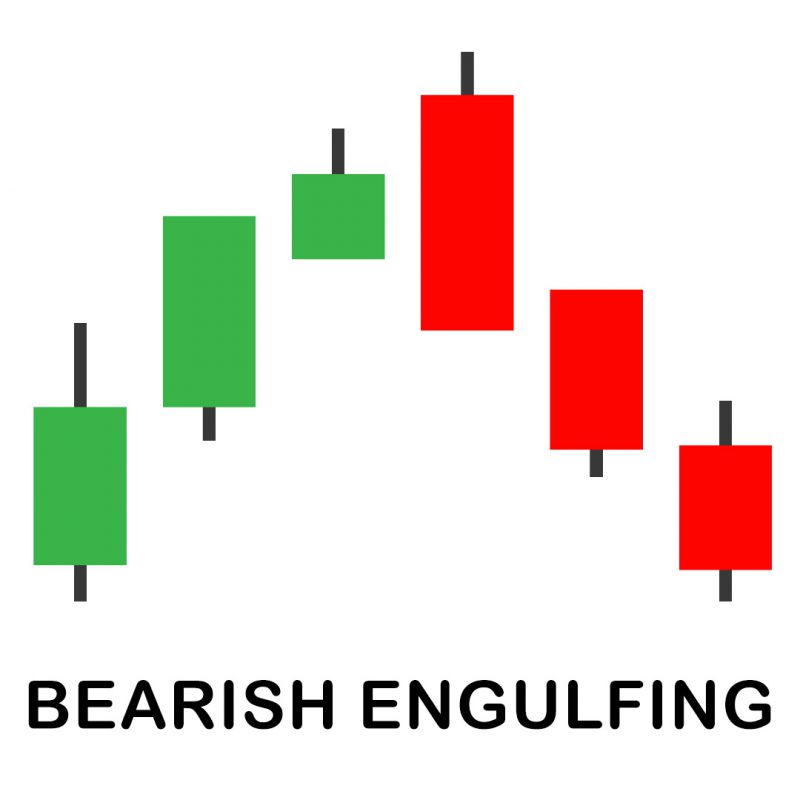
- Bearish Engulfing: A large red candlestick engulfing a smaller green one, indicating growing bearish momentum.
- Evening Star: A bearish counterpart to the Morning Star, this pattern signifies a reversal from bullish to bearish.

Continuation Patterns:
These indicate that the current trend is likely to persist. Common continuation patterns include:
- Doji: A candle with a similar opening and closing price, signifying market indecision.
- Spinning Tops: Small-bodied candles with long wicks, indicating a balance between buyers and sellers.


Application in Trading Strategies
Traders use candlestick patterns to identify potential entry and exit points. For instance, a Hammer pattern in a downtrend might signal a good buying opportunity, while a Shooting Star in an uptrend could suggest a selling point. However, reliance on a single pattern is risky; traders often confirm signals with other technical indicators like moving averages or relative strength index (RSI).
Combining Candlestick Patterns with Other Analysis
For enhanced accuracy, candlestick patterns should be used in conjunction with other forms of analysis:
- Technical Indicators: Tools like Bollinger Bands or MACD can validate the signals provided by candlestick patterns.
- Volume Analysis: High trading volume can confirm the strength of a candlestick pattern.
- Fundamental Analysis: Understanding underlying economic factors can provide context to the patterns observed.
Psychology Behind Candlestick Patterns
Candlestick patterns reflect the psychological dynamics of the market. For example, a Bullish Engulfing pattern shows a shift in sentiment from bearish to bullish, indicating that buyers are gaining control. Recognizing these psychological aspects can provide traders with a deeper understanding of market movements.
Limitations and Considerations
While candlestick patterns are valuable, they are not infallible. False signals are common, and patterns should not be used in isolation. Market context and overall trend analysis are crucial for interpreting these patterns correctly.
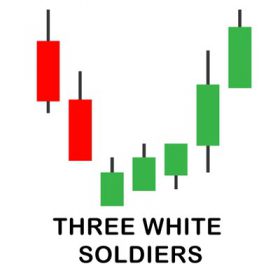
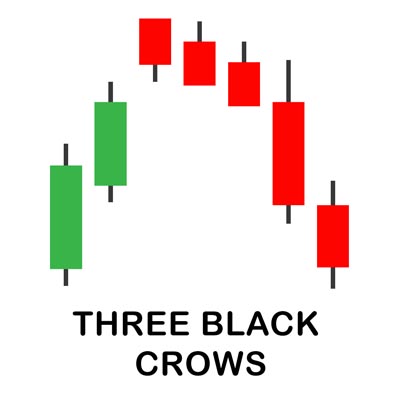
Advanced Candlestick Patterns
Experienced traders often look for more complex patterns, such as the ‘Three White Soldiers’ or ‘Three Black Crows’, which offer more nuanced insights into market trends.
Conclusion
Candlestick patterns can be an essential component of technical analysis in trading, providing a visual representation of market sentiment and price movement. This can potentially offer insight into market trends and reversals. However, their effectiveness may increase when combined with other analytical tools and an understanding of market context. As with any trading tool, practice and experience are key to mastering candlestick pattern analysis. With practice and experience, traders can effectively incorporate candlestick patterns into their trading strategies to improve decision-making and market performance, though the risks involved in trading are significant, and there are no trading methods that can guarantee positive results.
The information provided in the WCA Education Center does not, and is not intended to, constitute financial advice and all information, content, and materials available in the WCA Education Center are for general informational purposes only. This information may not constitute the most up-to-date information. The WCA Education Center may contain information from or links to other third-party websites. Such links are only for the convenience of the reader, user or browser; World Cup Advisor and its affiliates do not recommend or endorse the contents of any third-party sites.
Trading futures and forex involves significant risk of loss and is not suitable for everyone. Past performance is not necessarily indicative of future results.

