
Trading futures and forex involves significant risk of loss and is not suitable for everyone. Past performance is not necessarily indicative of future results.
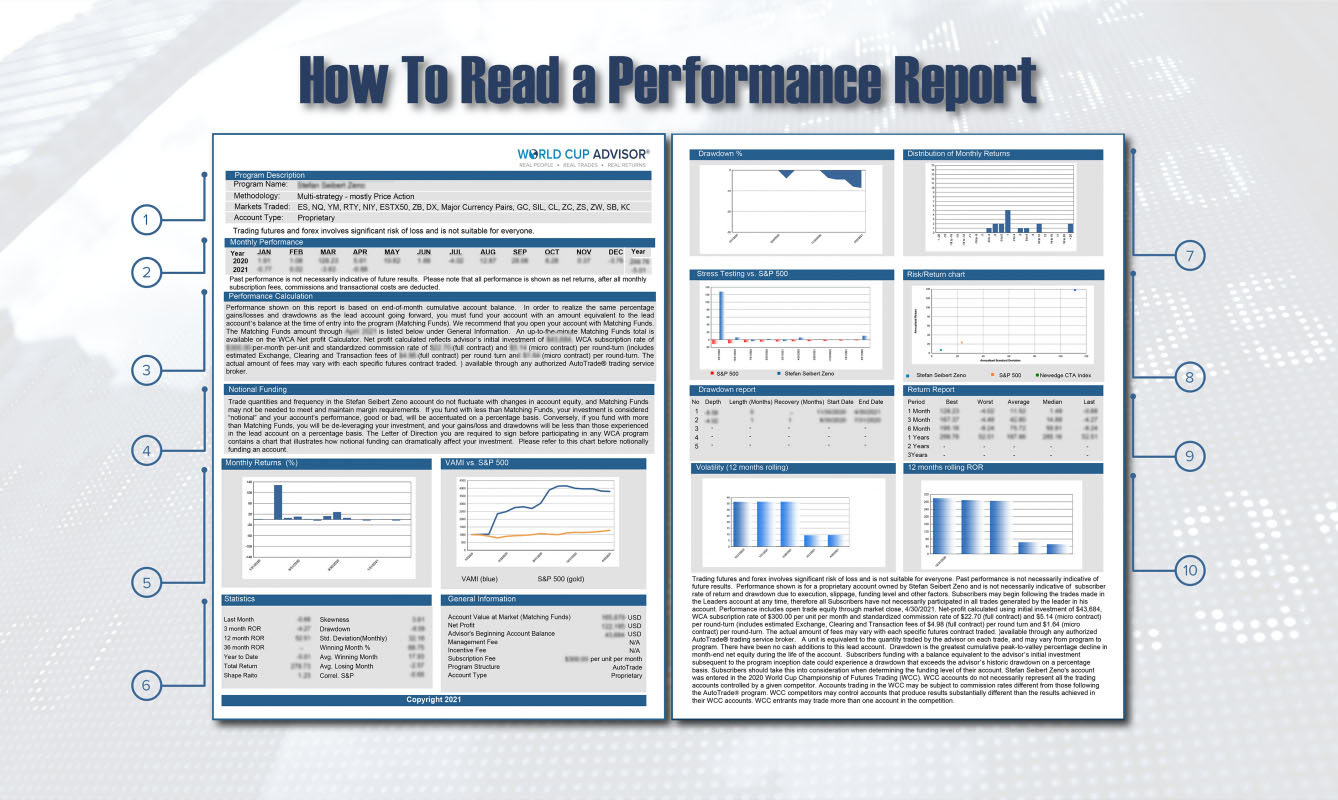
At World Cup Advisor you’re in control when it comes to choosing the best advisor to follow for achieving your trading goals. We search far and wide for futures and forex traders willing to put their own money on the line to prove their capabilities. When evaluating our advisors you have access to their track records and comprehensive performance reports. With all of this data available, you may need a guide for digesting this information. Continue below for a comprehensive breakdown of navigating through financial performance reports.
Section 1 – Program Description
This section covers all of your initial need to know details like who, what, and where. In the example above you see the name of the program, what contracts it trades, its methodology, and the type of account.
Section 2 – Monthly Performance
When displaying monthly performance at World Cup Advisor our figures are inclusive of all monthly subscription fees, commissions, and transactional costs, therefore showing you the net returns. By analyzing how the program has performed over time you can get an accurate understanding of the way the program ebbs and flows. It is very important to remember that past performance is not necessarily indicative of future results. Trading futures and forex involves significant risk of loss and is not suitable for everyone.
Section 3 – Performance Calculation
If your trading goal is to follow an advisor and make the same profits as him/her you’ll have to ensure that all aspects of your trading account follow theirs as well. This section outlines the details you’ll need to keep in mind when matching your follower account to the leader account such as initial funding amount and fees you’ll be subject to. This approach ensures that both account’s performance is being calculated the same way.
Section 4 – Notional Funding
You do have the ability to fund your account differently than the Advisor you choose to follow has. If you’re wanting to fund your account over or under the matched amount your investment is considered ‘notional’ and performance will be calculated differently. This section explains how over or under funded accounts’ performance would be displayed.
Section 5 – Monthly Returns
The chart on the left side of this section displays the monthly percentage returns. This allows investors to get a visual representation of the over-all movement in the program. The chart on the right side of this section displays VAMI performance compared to the performance of the S&P 500. VAMI (value added monthly index) tracks the monthly performance of a hypothetical $1000 investment, assuming reinvestment, over a period of time. For example, a total return of 39% over the year would equal a VAMI index of 1390.
Section 6 – Statistics and General Information
While section 1 outlined key details such as who, what, and where, section 6 breaks down even more details including the most recent month’s performance, the rate of return over 3 months, 12 months, and 36 months, year to date performance, the program’s total return and more. The right side of this section is important to understand as the advisor’s beginning account balance, current account value, and applicable fees are listed here.
Section 7 – Drawdown and Distribution of Monthly Returns
As an investor it is your responsibility to equally evaluate both the returns and drawdowns of a trading program. On the left side of this section you will see the drawdowns displayed. A drawdown is a peak to bottoming out decline during a specific period for a trading account. It’s important to understand the drawdown of each trading program you consider so that you understand the potential risk of your investment in this program. If you consider the risk of the program in question worth the returns outlined on the right side of section 7 then the program may be a good fit for you.
Section 8 – Stress Testing vs. S&P 500 and Risk/Return Chart
At any time a crisis can hit our world, potentially effecting the economy in a negative way. The chart on the left side of section 8 shows how the trading program in question performed against the negative periods of a well-known product like the S&P 500. To comprehend just how this measures against a well-known product like the S&P 500, the two are shown side by side. The risk-return chart trade off states that the potential return rises with an increase in risk. Therefore low levels of uncertainty are associated with low potential returns and high levels of uncertainty are associated with high potential returns. This section displays the risk-return level of the program in question and again shows a well-known product like the S&P 500 and Newedge CTA Index for comparison purposes.
Section 9 – Drawdown Report and Return Report
Very similar to section 7, this section displays drawdowns and returns but this time in numeric figures instead of a visual representation. Investors should always analyze both versions of this information.
Section 10 – Volatility and Rate of Return
Volatility is a way to measure the size of values expected for a variable in a given market. In most cases, the higher the volatility, the riskier the product or trading program. How volatile a program may be is a key factor when deciding if the program is a good fit for you. The chart on the left side of this section displays how volatile the program has been on a 12 months rolling basis. The chart on the right side of this section displays how profitable the program has been on a 12 months rolling basis. As previously stated, it is vital that investors evaluate both the risk and the potential reward before pursuing a program.
Trading futures and forex involves significant risk of loss and is not suitable for everyone. Past performance is not necessarily indicative of future results. This web site is intended as a solicitation for leader-follower AutoTrade programs offered by WorldCupAdvisor.com (WCA). There is unlimited risk of loss in selling options. An investor must read, understand and sign a Letter of Direction for WCA programs before investing. There are no guarantees of profit no matter who is managing your money. Net-profit data wherever displayed on WCA includes open trade equity if any as of market close on the date listed, and is calculated using current WCA subscription rates, standardized commission rates (includes estimated Exchange, Clearing and Transaction fees per round turn. The actual amount of fees may vary with each specific futures contract traded but not NFA fees) and funding requirements available through any authorized AutoTrade broker. For detail on commission calculations, open the Net-Profit Calculator. Trades displayed on WorldCupAdvisor.com are from proprietary accounts that are either owned by the advisor or are entities of which the advisor is a beneficial owner. Performance data shown for lead accounts is not necessarily indicative of subscriber rate of return and drawdown due to execution, slippage, subscriber funding level and other factors.

