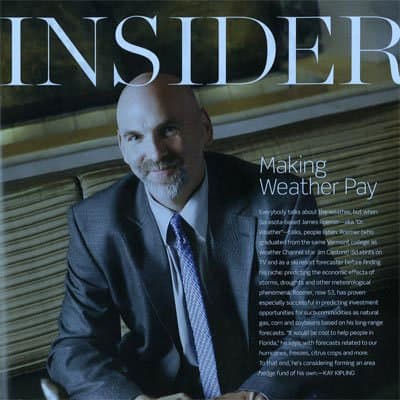
Trader Spotlight - Jim Roemer

Jim is a meteorologist, futures trader, and past top performer in the World Cup Trading Championships®.

He has worked with major hedge funds, Midwest farmers, and individual traders for over 35 years. With emphasis on interpreting how weather impacts market pricing and market psychology, coupled with his short and long-term trend forecasting in grains, softs, and the energy markets. Jim has established a unique standing among advisors in the commodity risk management industry.

View Jim's Trades With a Free Guest Membership

In the book High Performance Futures Trading, (by Joel Robbins – 1991), Jim Roemer contributed chapter 17: How to Turn Droughts, Floods and Hurricanes into Successful Speculative Opportunities. The introduction written by Mr. Robbins stated: “Mr. Roemer currently supplies brokerage houses, traders and farmers with weather and/or trading information.”

Today, Mr. Roemer owns Best Weather Inc., offering weather-related research to commodity traders and farmers. Several times per week, he posts The Weather Wealth blog, which includes both short-term and long-term forecasts and trading ideas in futures, options and ETFs. On a monthly basis he publishes the Climatelligence newsletter. He also is co-founder of Climate Predict, a detailed long-range global weather forecast tool.

As one of the first meteorologists to become an NFA member and registered with the Commodity Trading Commission, he has worked with major hedge funds, Midwest farmers, and individual traders for over 35 years. Frequently quoted in commodity sector publications in the financial press, Bloomberg radio and TV feature interviews with Mr. Roemer during times when the weather is a critical element in financial news reporting. With special emphasis on interpreting market psychology, coupled with his short and long-term trend forecasting in grains, softs, and the energy markets, he established a unique standing among advisors in the commodity risk management industry.

The profile above includes statements of opinion. Trading involves substantial risk of loss and is not suitable for everyone. Past performance is not necessarily indicative of future results.

Performance includes open trade equity through April 25, 2024. Trading futures and forex involves significant risk of loss and is not suitable for everyone. Past performance is not necessarily indicative of future results.
    • ADVISOR
      PROGRAM
    • ...
      METHODOLOGY
      SUBSCRIPTION
    • INITIAL INVESTMENT
      DRAWDOWN
    • NET PROFIT
      MONTHS
    • %
      NET RETURN
      MATCHING FUNDS
    • VIEW TRADES
    • ADVISOR
      PROGRAM
      SUBSCRIPTION
    • ...
      METHODOLOGY
    • INITIAL INVESTMENT
      %
      NET RETURN
    • DRAWDOWN
      NET PROFIT
    • MATCHING FUNDS
      MONTHS
    • VIEW TRADES
Matching funds is an amount equal to the advisor's account balance at the time of entry into the program. A unit is equivalent to the quantity traded by the advisor on each trade, and may vary from program to program. Performances are for proprietary accounts that are either owned by the advisor or are entities of which the advisor is a beneficial owner. There have been no net cash additions to these lead account. Peak-to-valley draw-down is the greatest cumulative percentage decline in month-end net equity during the life of the account. Subscribers funding with a balance equivalent to the advisor's initial investment subsequent to the program inception date could experience a drawdown that exceeds the advisor's historic drawdown on a percentage basis. Subscribers should take this into consideration when determining the funding level of their account. When the commission rate has changed during the life of a program, performance data is calculated using rates that applied during specific periods of time.

***Ivan Scherman's 2023 account is for informational purposes. His 2024 account is available for Leader-Follower® AutoTrade® Clients.