
What is Sharpe Ratio?
The Sharpe ratio is a widely used way of measuring the risk-adjusted return of an investment. It was developed by William F. Sharpe, a Nobel laureate in economics. The ratio helps investors evaluate the performance of an investment or a portfolio by considering both the returns earned and the level of risk taken.
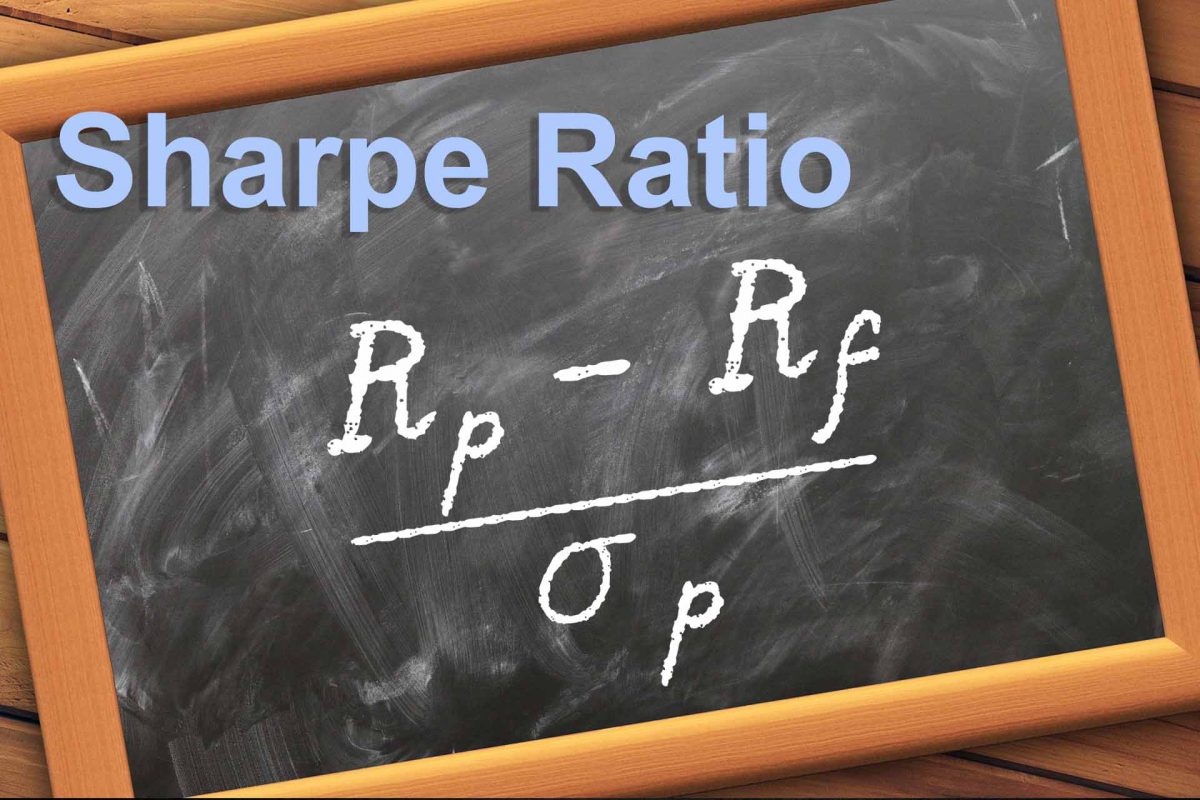
The Sharpe ratio is calculated by subtracting the risk-free rate of return from the investment’s average return and dividing the result by the investment’s standard deviation. The formula is as follows:
Sharpe Ratio = (Average Return of Investment – Risk-Free Rate) / Standard Deviation of Investment
Here’s a breakdown of the components:
- Average Return of Investment: This is the average annualized return achieved by the investment or portfolio over a specific period.
- Risk-Free Rate: It represents the return an investor could achieve by investing in a risk-free asset, such as government bonds or treasury bills. The risk-free rate is typically considered to be a proxy for the time value of money or a minimally acceptable return with no risk.
- Standard Deviation of Investment: This measures the volatility or variability of the investment’s returns. It quantifies the investment’s risk by examining how much the returns deviate from their average. A higher standard deviation indicates greater price volatility and, thus, higher risk.
The Sharpe ratio essentially captures the excess return earned by an investment relative to the risk-free rate per unit of risk taken. A higher Sharpe ratio indicates better risk-adjusted performance, as it suggests that the investment generated higher returns relative to its volatility or risk.
Investors often use the Sharpe ratio to compare the risk-adjusted returns of different investments or portfolios. However, it’s important to note that the Sharpe ratio is based on historical data and may not accurately predict future performance. It is just one tool among several that investors employ when making investment decisions.
Performance Analysis
When analyzing a given investment’s performance – be it an individual stock or a broad market index – many investors focus on the return produced over a specific period. For instance, an investor might judge how well Apple’s common stock performed by looking at the total return over the last calendar year. This is referred to as a holding-period return. Hypothetically, let us say that Apple was up 10% over the previous year. A solid return, no doubt. However, this level of analysis considers absolute return only, without regard for the corresponding level of risk associated with the investment. It is a surface-level analysis.
While the 10% return described above is attractive, astute investors should take their analysis further by incorporating risk into the framework. Risk and return are joined at the hip: investors cannot achieve outsized returns without assuming outsized risk. All else equal, investors would prefer to get as much return as possible for as little risk as possible. Thus, when presented with a menu of investments that could potentially earn 10%, the investor would choose the investment with the lowest risk. Although it can take many forms, risk is most commonly measured by the standard deviation metric. Statistically, the standard deviation of returns is the variability or volatility of returns around the average. The higher the standard deviation, the riskier the investment.
Calculating the Sharpe Ratio
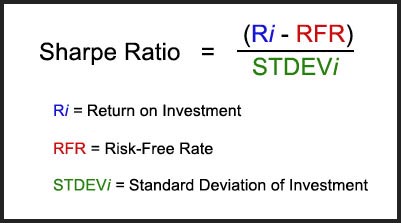
Since investors will always choose the highest returning investment for a given level of risk, they should incorporate reward-to-risk ratios into performance analysis to get a clearer picture of their experience in the investment. There are several such ratios, but the most commonly used metric is called the Sharpe Ratio. The metric was conceived by the economist William Sharpe, for which he won a Nobel Prize. The numerator begins with the return on a given investment and subtracts the risk-free rate (RFR) of return. In most cases, the RFR is assumed to be either cash or short-term US government treasury bonds as they are seen as having almost no possibility of default (hence being risk-free). This is also referred to as the excess return, as it displays any return over and above the RFR.
The numerator is then divided by the investment’s standard deviation, and the mathematical result is the investment’s Sharpe Ratio for a given holding period. Visually, the Sharpe Ratio can be displayed as:
What Is a Good Sharpe Ratio?
A higher Sharpe ratio generally indicates better risk-adjusted performance. However, what is considered a “good” Sharpe ratio can vary depending on the investment strategy, risk appetite, and market conditions. There is no universally agreed-upon threshold for a “good” Sharpe ratio, as it can differ across asset classes and investment styles.
In general, a positive Sharpe ratio is considered desirable, as it indicates that the investment or portfolio has generated returns above the risk-free rate per unit of risk taken. A Sharpe ratio of 1 or higher is often seen as an acceptable threshold for good performance, but it’s important to interpret it within the context of the specific investment or strategy.
Moreover, it’s crucial to compare the Sharpe ratio of a particular investment or portfolio with relevant benchmarks or peer groups. For example, if you’re evaluating a mutual fund, you may want to compare its Sharpe ratio against other funds in the same category or against a relevant market index. This comparison provides a relative measure of performance and helps you assess how the investment is performing in relation to its peers or the broader market.
Keep in mind that the Sharpe ratio should not be the sole determinant for investment decisions. It’s important to consider other factors such as investment objectives, time horizon, risk tolerance, and qualitative aspects of the investment strategy. Additionally, historical performance may not necessarily guarantee future results, so it’s essential to conduct thorough research and analysis before making investment decisions.
Is There Such Thing As A Negative Sharpe Ratio?
Yes, it is possible to have a negative Sharpe ratio. The Sharpe ratio measures the risk-adjusted return of an investment or portfolio by subtracting the risk-free rate from the average return and dividing it by the standard deviation. If the investment’s average return is lower than the risk-free rate or if the standard deviation is very high, the result can be a negative Sharpe ratio.
A negative Sharpe ratio suggests that the investment or portfolio has not generated returns above the risk-free rate in relation to the level of risk taken. It indicates that the investment’s returns have not compensated for the volatility or risk associated with it.
Negative Sharpe ratios are often seen in investments or portfolios with poor performance or higher levels of risk. It may indicate that the investment has experienced significant losses or that its returns have been highly volatile.
However, it’s important to note that a negative Sharpe ratio on its own does not necessarily imply that the investment is “bad” or that it should be avoided. The context and comparison with relevant benchmarks or peer groups are crucial in evaluating the performance. It’s also important to consider the investment strategy, time horizon, and risk tolerance when interpreting the Sharpe ratio.
What Is the Difference Between Sharpe Ratio and Treynor Ratio?
The Sharpe ratio and the Treynor ratio are both risk-adjusted performance measures used in finance, but they differ in terms of the risk measure used in their calculations.
The Sharpe ratio, developed by William F. Sharpe, measures the risk-adjusted return of an investment or portfolio by considering the excess return earned above the risk-free rate per unit of total risk (as measured by standard deviation). The formula for the Sharpe ratio is:
Sharpe Ratio = (Average Return of Investment – Risk-Free Rate) / Standard Deviation of Investment
The Sharpe ratio takes into account both the investment’s average return and its volatility or standard deviation, making it a widely used measure for evaluating the risk-adjusted performance of an investment.
On the other hand, the Treynor ratio, named after Jack Treynor, measures the risk-adjusted return by considering the excess return earned above the risk-free rate per unit of systematic risk, which is measured by beta. The formula for the Treynor ratio is:
Treynor Ratio = (Average Return of Investment – Risk-Free Rate) / Beta of Investment
The Treynor ratio focuses on systematic risk, which is the risk associated with the investment’s sensitivity to overall market movements. It uses beta, a measure of systematic risk, in its calculation. Beta represents the investment’s sensitivity to market fluctuations, with a beta of 1 indicating the investment moves in line with the market, a beta greater than 1 indicating higher sensitivity, and a beta less than 1 indicating lower sensitivity.
While the Sharpe ratio considers the total risk of an investment (captured by standard deviation), the Treynor ratio focuses on the systematic risk (captured by beta). The Treynor ratio is particularly useful for evaluating the performance of investments within the context of a well-diversified portfolio.
Both ratios are used to assess the risk-adjusted performance of investments or portfolios, but their emphasis on different risk measures (total risk vs. systematic risk) makes them complementary tools for evaluating investments from different angles.
The formula for the Treynor ratio is:
Treynor Ratio = (Average Return of Investment – Risk-Free Rate) / Beta of Investment
The Treynor ratio focuses on systematic risk, which is the risk associated with the investment’s sensitivity to overall market movements. It uses beta, a measure of systematic risk, in its calculation. Beta represents the investment’s sensitivity to market fluctuations, with a beta of 1 indicating the investment moves in line with the market, a beta greater than 1 indicating higher sensitivity, and a beta less than 1 indicating lower sensitivity.
While the Sharpe ratio considers the total risk of an investment (captured by standard deviation), the Treynor ratio focuses on the systematic risk (captured by beta). The Treynor ratio is particularly useful for evaluating the performance of investments within the context of a well-diversified portfolio.
Both ratios are used to assess the risk-adjusted performance of investments or portfolios, but their emphasis on different risk measures (total risk vs. systematic risk) makes them complementary tools for evaluating investments from different angles.
What Is the Difference Between Sharpe Ratio and Sortino Ratio?
The Sharpe ratio and the Sortino ratio are both risk-adjusted performance measures used in finance, but they differ in the way they account for downside risk and the associated volatility.
The Sharpe ratio, as mentioned earlier, measures the risk-adjusted return of an investment or portfolio by considering the excess return earned above the risk-free rate per unit of total risk (standard deviation). It considers both upside and downside volatility in its calculation. The formula for the Sharpe ratio is:
Sharpe Ratio = (Average Return of Investment – Risk-Free Rate) / Standard Deviation of Investment
The Sharpe ratio penalizes both positive and negative deviations from the average return, assuming that both represent risk. It provides a measure of the investment’s risk-adjusted return relative to its total volatility.
On the other hand, the Sortino ratio, developed by Frank A. Sortino, focuses specifically on downside risk and seeks to provide a more accurate assessment of an investment’s risk-adjusted performance by considering only the downside volatility. It is particularly useful for investors who are more concerned about protecting against losses rather than overall volatility. The formula for the Sortino ratio is:
Sortino Ratio = (Average Return of Investment – Risk-Free Rate) / Downside Deviation of Investment
The Sortino ratio replaces the total standard deviation used in the Sharpe ratio with downside deviation, which is a measure of the volatility of returns below a certain threshold (often the risk-free rate or a minimum acceptable return).
By considering only downside volatility, the Sortino ratio focuses on the risk associated with negative returns and provides a more targeted evaluation of an investment’s performance in adverse market conditions. This can be a more useful tool for some investors than the Sharpe ratio, but it’s very common for investors to consider both the Sharpe and Sortino ratio of an investment when evaluating an investment.
In summary, the Sharpe ratio considers both upside and downside volatility to measure risk-adjusted performance, while the Sortino ratio focuses solely on downside volatility. The Sortino ratio is especially useful for investors who are particularly concerned about downside risk and want to assess an investment’s ability to protect against losses. As stated several times in this article, no single formula or metric should be relied upon to determine the suitability of an investment.
Benefits and Limitations of the Sharpe Ratio
The ratio should be interpreted as a risk-adjusted measure of performance, whereby an investor can standardize a variety of investments by risk and make an apples-to-apples comparison. The ratio can also be considered a measure of statistical efficiency, displaying to the investor how much return is produced for a given level of risk. All else equal, the higher the Sharpe Ratio, the better.
The beauty of the Sharpe Ratio lies in its simplicity. With a straightforward quotient, the Sharpe Ratio can cut through the noise and communicate to investors how much bang they are getting for each buck risked. As a result, higher Sharpe Ratio investments are more efficient, statistically speaking, and are therefore preferred over lower Sharpe Ratio investments by many investors.
However, investors should be wary of relying too heavily on the Sharpe Ratio alone when analyzing investment risk. There are several limitations to the Sharpe Ratio. First, risk may not be the prevailing factor that matters for a given investment. Volatility, as measured by standard deviation, may take a back seat to absolute return or other measures of investment performance such as CAGR (compound annual growth rate). In this case, a lower-returning investment may have a high Sharpe Ratio as a result of lower risk, but that lower volatility comes associated with lower overall returns. For investors that are willing and able to stomach some degree of risk, choosing investments with high Sharpe Ratios may result in foregone future returns.
Additionally, risk and volatility are not solely downside measures. Volatility works on both the upside and downside, and an investment with a high Sharpe Ratio (low volatility) may give up considerable upside for a smoother, less volatile ride. It depends on the investor’s definition of risk and how much they are willing to accept. It may be more appropriate for an investor to consider measures of downside risk only, such as upside/downside capture or the Sortino Ratio when comparing investment choices.
The data used to calculate Sharpe Ratios are always backward-looking and thus do not provide any insight into expected future returns. It is important to note that past performance is not necessarily indicative of future results, and no investor can say for sure what will happen in the future.
Finally, the ratio is less meaningful when analyzing individual investments and trades. Instead, it is optimal to compare Sharpe Ratios within a larger portfolio of numerous, diverse investments. Indeed, the originator of the ratio, William Sharpe himself, has claimed that the metric ought to be used primarily for an entire portfolio, as in some cases, an investment with a low Sharpe Ratio may be more beneficial to the portfolio in entirety. After all, what really matters is how each investment interacts with the other within a larger, complete portfolio, and that is where the power of the Sharpe Ratio comes into play.
Key Takeaways
The Sharpe Ratio is an excellent descriptor of the interaction of return and risk for a given investment over a given time period. It is a great starting point to consider the range of expected future risk and return scenarios. When applied to complete portfolios, it is likely that Sharpe Ratio considerations could result in better decisions about the tradeoff between return and risk. However, investors should avoid using the Sharpe Ratio in isolation and should avoid falling into the trap of using a backward-looking statistical measure such as the Sharpe Ratio to precisely forecast the future.
The information provided in the WCA Education Center does not, and is not intended to, constitute financial advice and all information, content, and materials available in the WCA Education Center are for general informational purposes only. This information may not constitute the most up-to-date information. The WCA Education Center may contain information from or links to other third-party websites. Such links are only for the convenience of the reader, user or browser; World Cup Advisor and its affiliates do not recommend or endorse the contents of any third-party sites.
Trading futures and forex involves significant risk of loss and is not suitable for everyone. Past performance is not necessarily indicative of future results.

