The Complete Guide to Reading Candlestick Patterns
Table of Contents
Introduction
Candlestick patterns, a cornerstone of technical analysis in trading, offer a vivid depiction of market sentiment and price action. Originating from 18th-century Japan, these patterns provide traders with valuable insights, aiding in making informed decisions. This guide explores the intricacies of candlestick patterns, illuminating their significance in forecasting market movements.
Understanding Candlesticks
Each candlestick represents price movements within a specified time frame, displaying the opening, closing, high, and low prices. The ‘body’ shows the range between the open and close, while ‘wicks’ or ‘shadows’ indicate the high and low. The color coding—usually green or red—signals bullish or bearish sentiments, respectively.
Basic Patterns
Basic candlestick patterns, the building blocks of analysis, are categorized into single and dual patterns. A single candle pattern, like a ‘Doji,’ signifies market indecision, while a ‘Hammer’ suggests bullish reversal. Dual patterns, such as the ‘Bullish Engulfing’ and ‘Bearish Engulfing,’ highlight shifts in market dynamics, indicating potential trend reversals.
Reversal and Continuation Patterns
Critical for predicting market shifts, reversal patterns like ‘Morning Star’ and ‘Evening Star’ indicate bullish and bearish turnarounds, respectively. In contrast, continuation patterns, such as ‘Falling Three Methods’ and ‘Rising Three Methods,’ suggest the persistence of the current trend. Recognizing these patterns helps traders anticipate potential market movements.
Complex Patterns
For a deeper market analysis, complex patterns involving multiple candlesticks come into play. Patterns like ‘Head and Shoulders’ and ‘Cup and Handle’ are pivotal in understanding market psychology and potential long-term trends. These patterns require a nuanced interpretation and are often validated over longer periods.
Practical Application
Effective trading strategies involve integrating candlestick patterns with other analytical tools. Combining these patterns with volume analysis and moving averages enhances the reliability of predictions. Moreover, understanding the context and market conditions is crucial, as patterns do not operate in isolation.
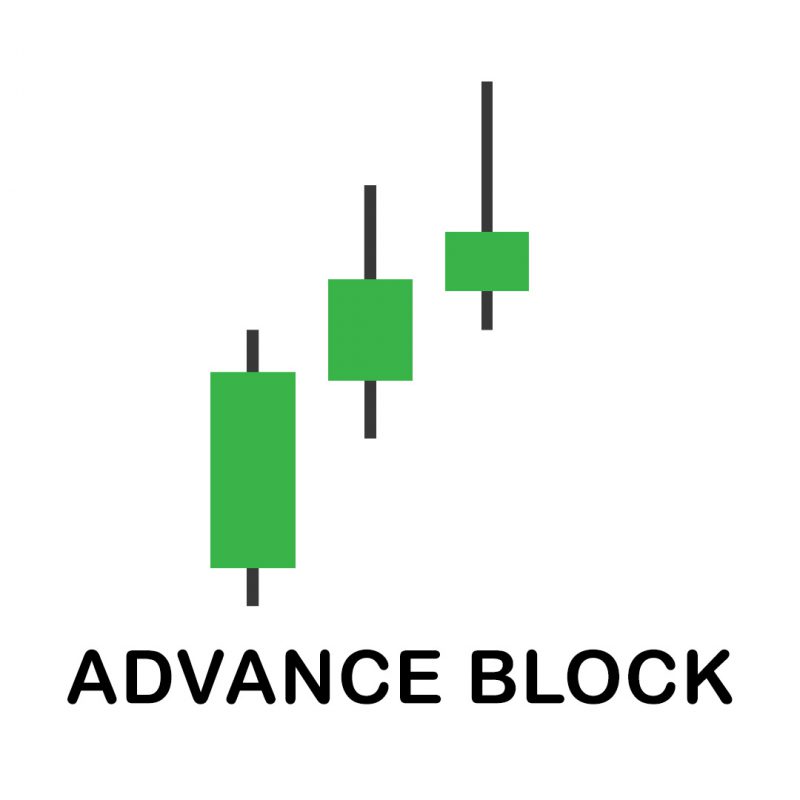
Advance Block
An “Advance Block” is a three-candle bearish pattern in trading, signaling a potential shift from an uptrend to a downtrend. This occurs when three progressively shorter green candles appear after an upward trend. While it suggests a reversal, success rates are modest. This pattern is more potent in larger downtrends and during pullbacks within them, especially with long-bodied candles. It signals a reversal when the subsequent bar crosses the first candle’s midpoint. Traders should use it cautiously, combining with other indicators for better reliability.
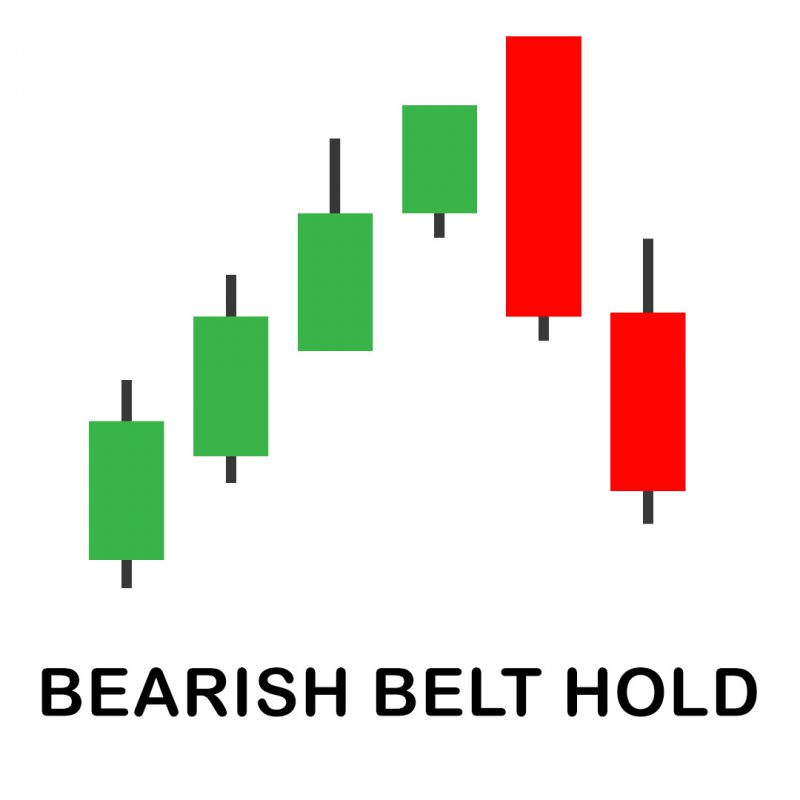
Bearish Belt Hold
A “Bearish Belt Hold” is a candlestick pattern occurring in an uptrend. It involves a red candlestick opening higher than the previous close, followed by a decline resulting in a long red candlestick. Despite signaling a shift from bullish to bearish sentiment, it’s not highly reliable as it occurs frequently and may inaccurately predict future prices. Confirmation requires observing trends over more than two days. The bearish belt hold is easily identifiable, but its validity is strengthened when the candlestick is long, and the subsequent session’s candlestick is also bearish.
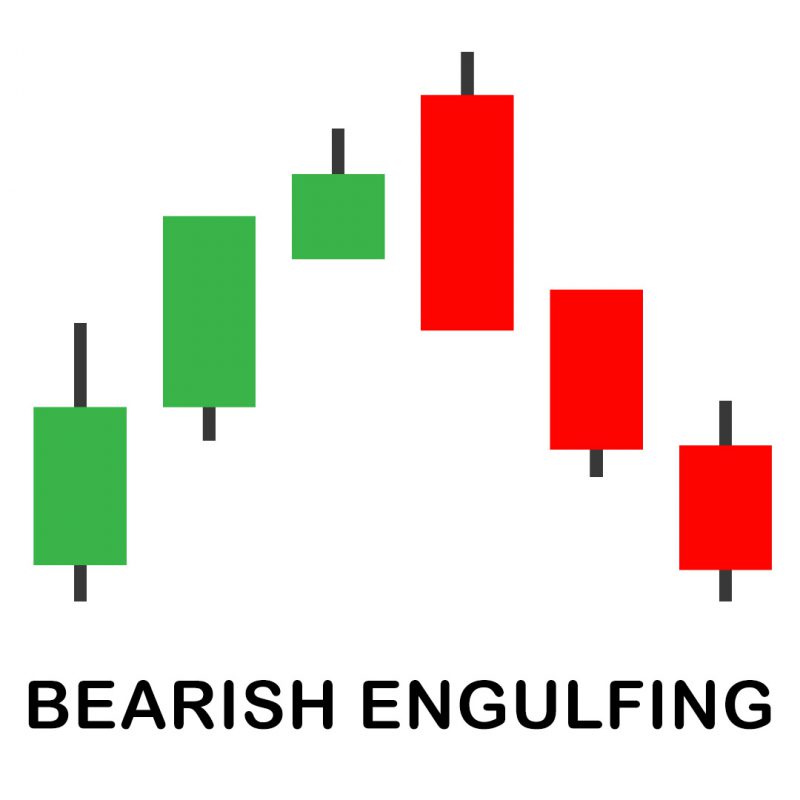
Bearish Engulfing
A “Bearish Engulfing” is a crucial technical chart pattern signaling an impending price drop. It appears after an up candle is overshadowed by a larger down candle, indicating a shift from buyer dominance to sellers pushing the price lower. The pattern gains significance after a price advance, emphasizing the downtrend. Larger candles add strength to the signal, with the real body of the down candle engulfing the up candle. Traders wait for the second candle to close before taking action, selling long positions or considering short positions. However, overall market conditions and trends should be carefully considered for informed decision-making
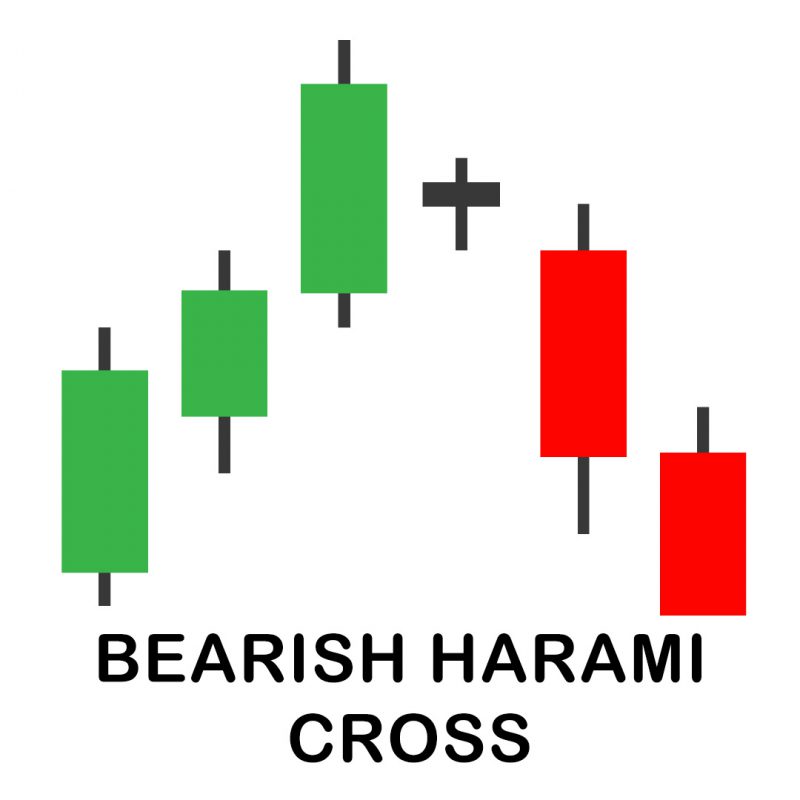
Bearish Harami Cross
A “Harami Cross” is a Japanese candlestick pattern indicating a potential trend reversal. It comprises a large candlestick in the trend direction, succeeded by a small doji entirely within the prior candle’s body. The bullish version, after a downtrend, signals a potential upward reversal, confirmed by a subsequent price increase. Conversely, the bearish version, after an uptrend, suggests a potential downward reversal, confirmed by a subsequent price decrease. It’s crucial that the doji remains within the prior candle’s body.
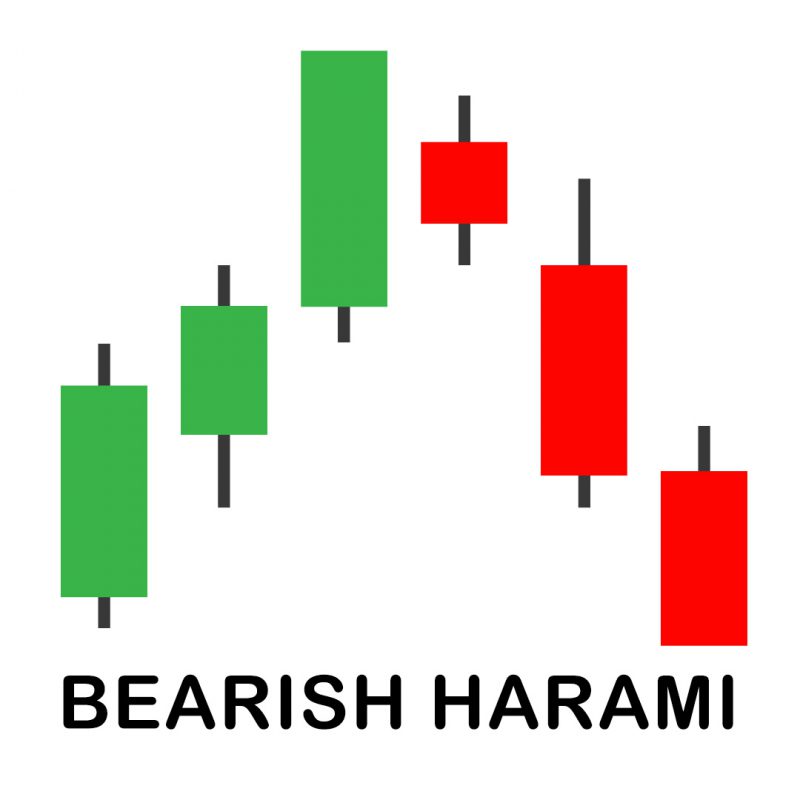
Bearish Harami
A “Bearish Harami”, a two-bar Japanese candlestick pattern, signals a potential reversal to the downside. It forms with a large green candle followed by a small red candle, and the second candle’s opening and closing prices must be within the first candle’s body. Occurring after an uptrend, the pattern’s potency is determined by the size of the second candle—the smaller, the higher the chance of a reversal. Traders often use technical indicators like RSI and stochastic oscillator to enhance the pattern’s reliability. Combining with a 200-day moving average can provide a comprehensive view for well-informed trading decisions during retracements
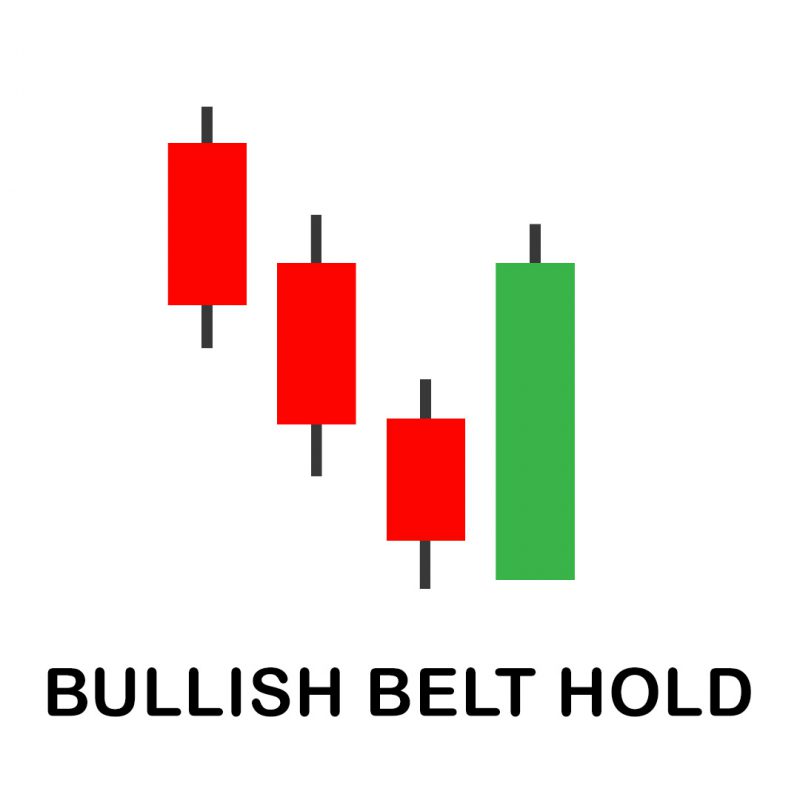
Bullish Belt Hold
A “Bullish Belt Hold” is a Japanese candlestick pattern signaling a potential reversal from a downtrend to an uptrend. It forms with a bullish candle opening lower than the previous day’s close, rising throughout the day, resulting in a long green candlestick with a short upper shadow. Recognizable by its appearance similar to a white Marubozu, this pattern is potent when appearing near support levels. Known as yorikiri in Japanese, it signifies a shift from bearish to bullish sentiment. While occurring frequently, its reliability is strengthened near support levels.
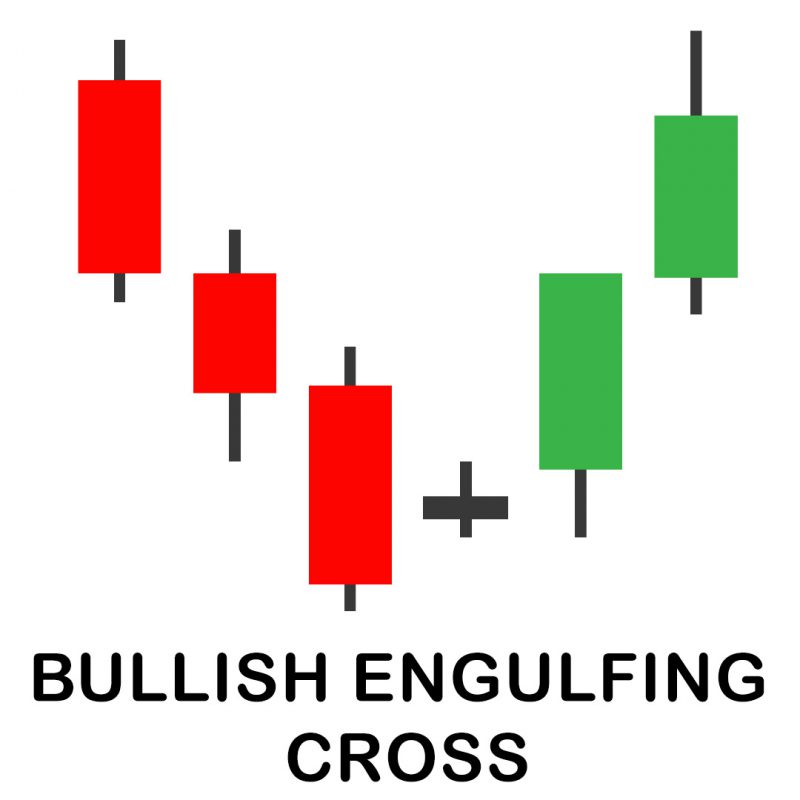
Bullish Engulfing Cross
The “Bullish Engulfing Cross” pattern on a candlestick chart signals a potential upward reversal. It unfolds with a small bearish candle followed by a larger bullish candle, entirely engulfing the previous candle’s body. This suggests a shift from bearish to bullish sentiment, indicating a possible uptrend.
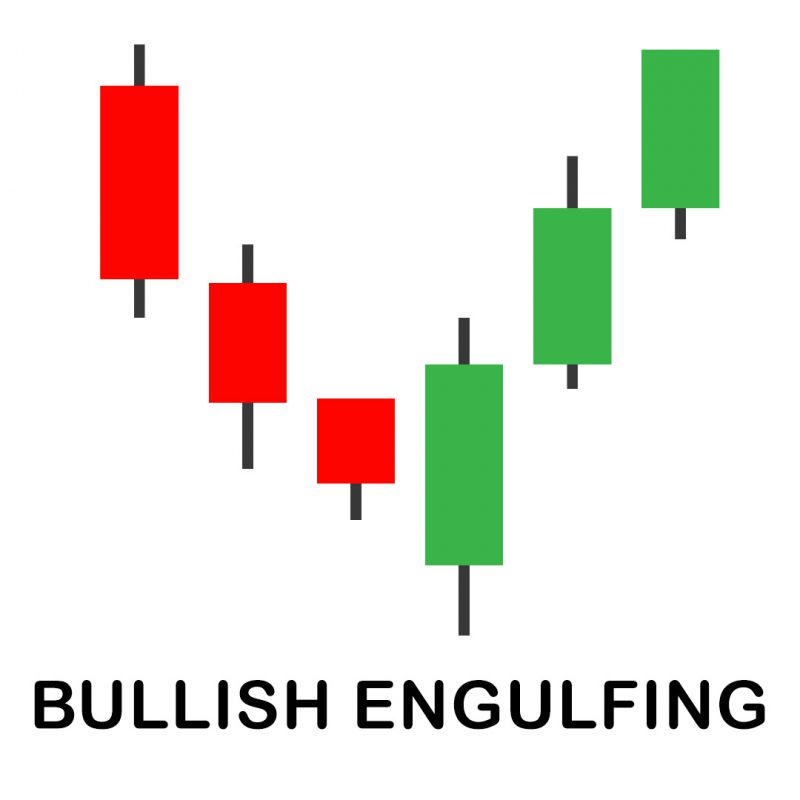
Bullish Engulfing
The “Bullish Engulfing” candlestick pattern signifies a shift in market dynamics, indicating buyers now dominate, potentially marking a market bottom. Identified by a large green candle overtaking a preceding small red one at the chart’s bottom, it provides early indications of a trend reversal. While easy to spot, relying on volume for confirmation adds precision. However, like any technical tool, it can yield false signals.
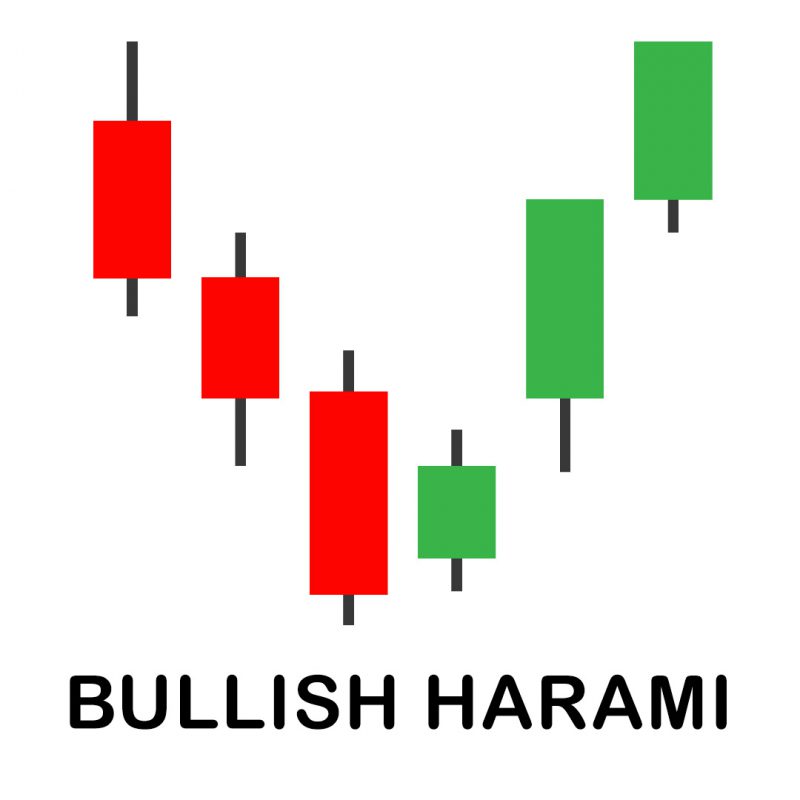
Bullish Harami
A “Bullish Harami”, a candlestick pattern, signals a potential reversal in a bearish trend. Represented by a small increase in price within recent downward movements, it suggests the end of a bearish trend. Shaped like a pregnant woman, the indicator requires close observation of daily candlestick charts. A long candle is followed by a smaller doji, contained within the previous body, indicating a likely reversal. While easy to spot, confirmation through subsequent market performance is crucial.
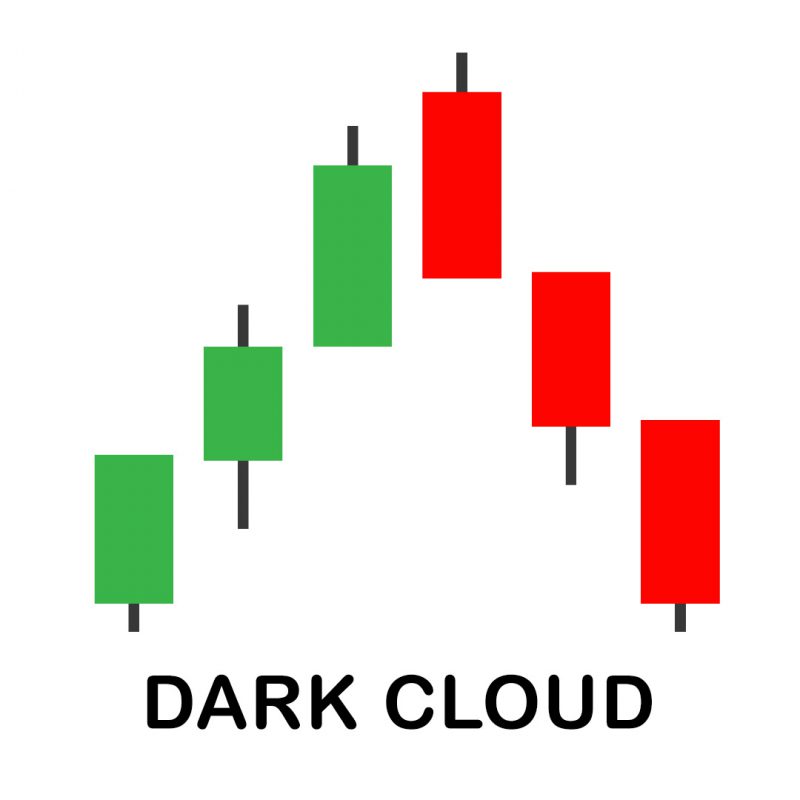
Dark Cloud
The “Dark Cloud”, a bearish reversal pattern, emerges at an uptrend peak. Following a bullish candle, a bearish one forms, closing lower than the middle of the bullish candle. Confirmation occurs when a subsequent candle breaches the bottom of both. Traders exit long positions at the bearish candle close, often shorting in forex. Stop loss goes above the bearish candle high, while exit and profit points rely on additional indicators.
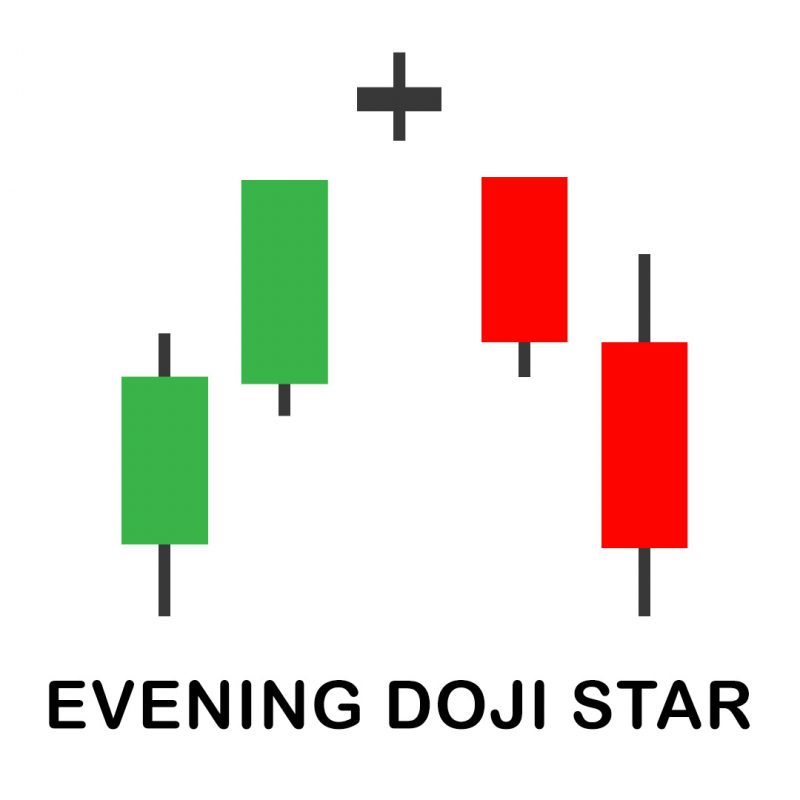
Evening Doji Star
The “Evening Doji Star”, a potent bearish reversal pattern, comprises three candles. It surfaces at a chart’s peak following an uptrend. The first bullish candle signifies ongoing positivity, followed by a doji signaling market indecision and waning buying pressure. The final strong bearish candle marks the shift from bullish to bearish trends. While offering a clear trend reversal indication with a favorable risk-to-reward ratio, caution is needed as false signals may arise. Traders can easily identify this pattern on a naked chart, using it alongside additional technical tools for a comprehensive analysis
Evening Star
The “Evening Star” candlestick pattern, a robust bearish reversal signal, unfolds across three candles. Commencing with a strong bullish candle, it transitions to a doji representing market indecision and waning buyer strength. The concluding strong bearish candle signifies a trend reversal. Positioned at a price chart’s zenith, traders often use this pattern to set stop losses above the doji’s high. While offering a high probability rate and beginner-friendly identification on a naked chart, caution is advised, as false signals may occur
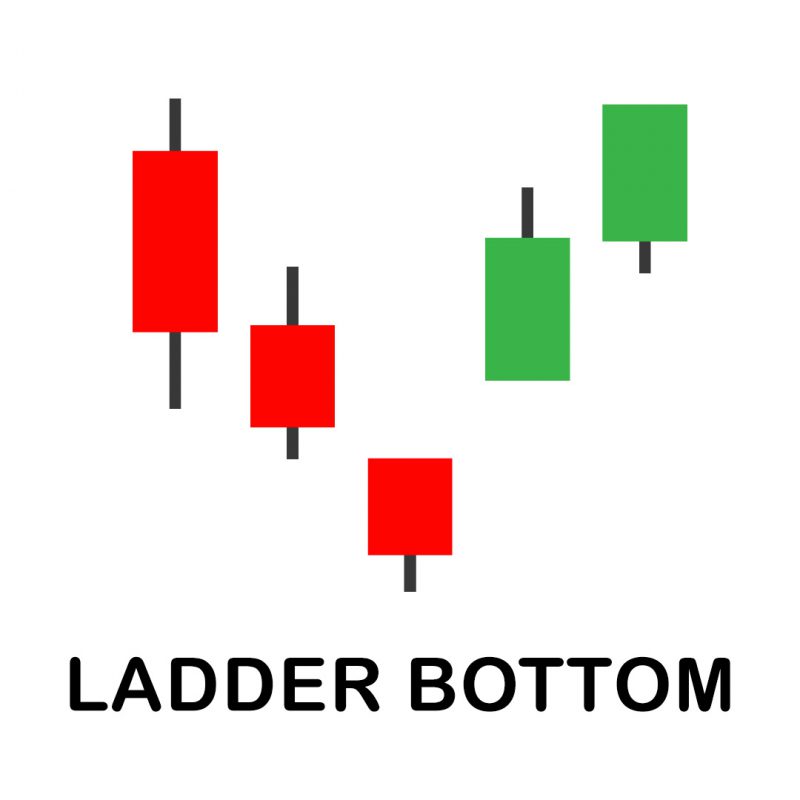
Ladder Bottom
The “Ladder Bottom” pattern, also referred to as a “Flypat Bottom”, on a candlestick chart indicates a potential trend reversal. It forms with a series of small candles at the bottom of a downtrend, resembling an airplane’s landing gear. This suggests a period of indecision followed by a possible upward shift. Recognizing such patterns is crucial for effective market analysis. Explore our educational resources to deepen your understanding of candlestick patterns and refine your trading strategies. Join us on a journey to unlock the complexities of financial markets, enhancing your skills for informed decision-making. Learn more about our work to elevate your understanding and proficiency.
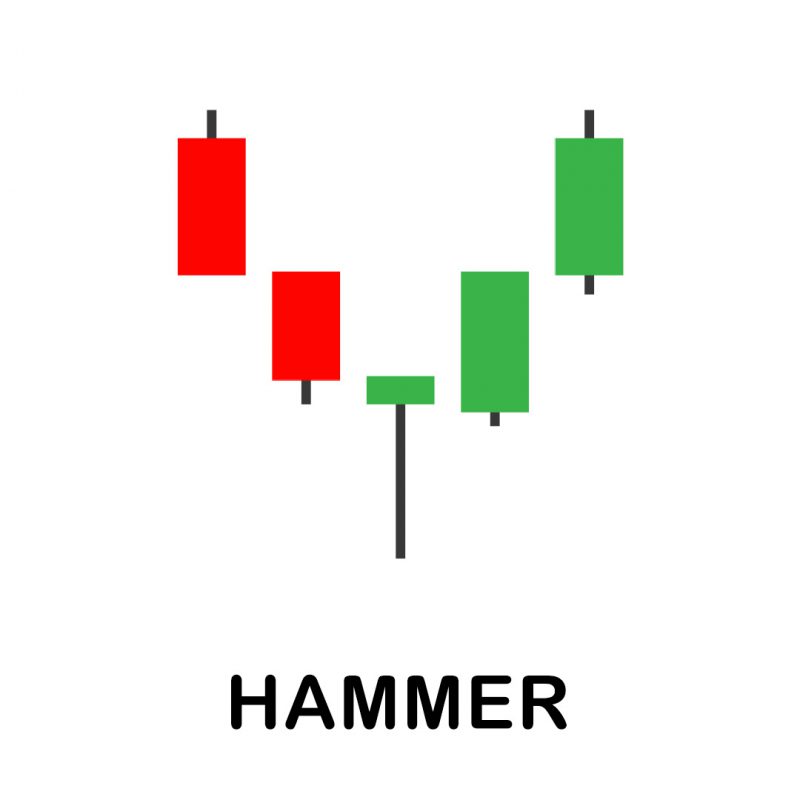
Hammer
The hammer candlestick signals a potential bullish trend reversal with a distinct appearance—a long lower wick and a short or no body—at the chart’s base. It symbolizes buyer strength, as despite initial selling pressure, buyers rally toward the candle’s close. Typically found at the market bottom after a downtrend, the hammer offers a clear signal of a potential trend shift and is easily identifiable. However, caution is warranted, as its reliability is lower compared to other candlestick patterns.
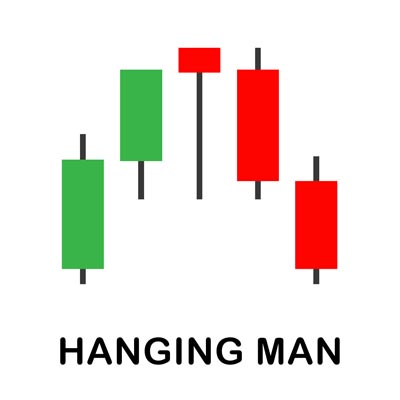
Hanging Man
The “Hanging Man” candlestick pattern, a bearish reversal signal, materializes at a price chart’s summit. Characterized by a long downside wick and minimal or no upper wick, it signifies a slowdown in buyer momentum and the advent of sellers. Typically following a bullish rally, the hanging man suggests a potential downturn. Recognizable by its distinct structure, the hanging man provides a robust indication of an impending trend reversal. However, caution is advised, as it may produce false trading signals.
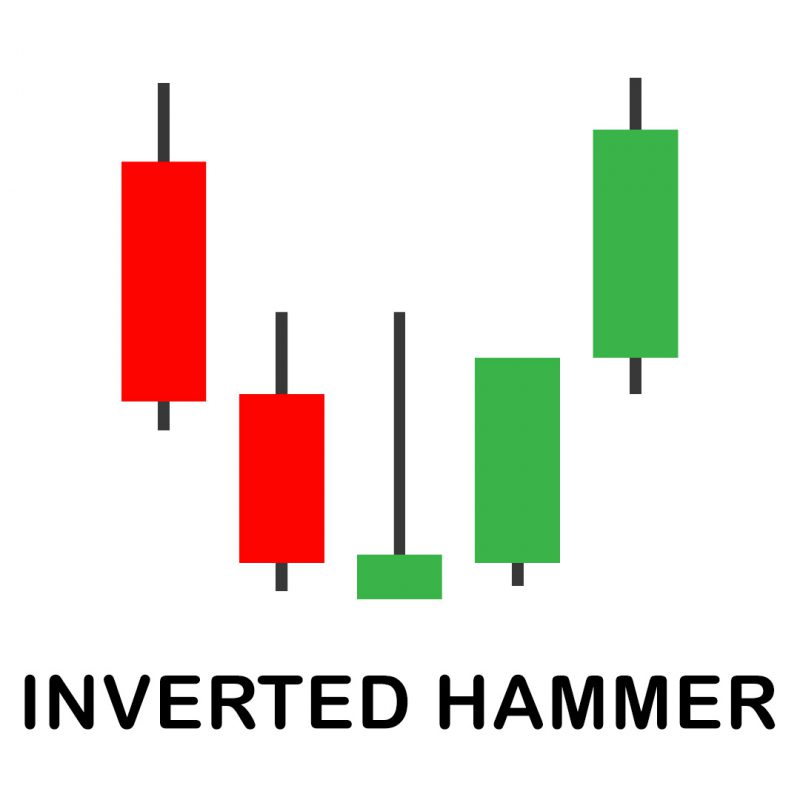
Inverted Hammer
The “Inverted Hammer”, a bullish reversal signal, manifests predominantly at downtrend bottoms. It serves as a potential precursor to a bullish reversal. Recognized by an open, low, and close near the same price and a long upper shadow at least twice the real body’s length, it hints at a market shift. In the aftermath of a prolonged downtrend, the Inverted Hammer suggests bullish sentiment. Although sellers initially prevail, the upward price movement underscores bulls challenging bears. Traders keenly observe subsequent market behavior for insights into potential upward or downward price trajectories.
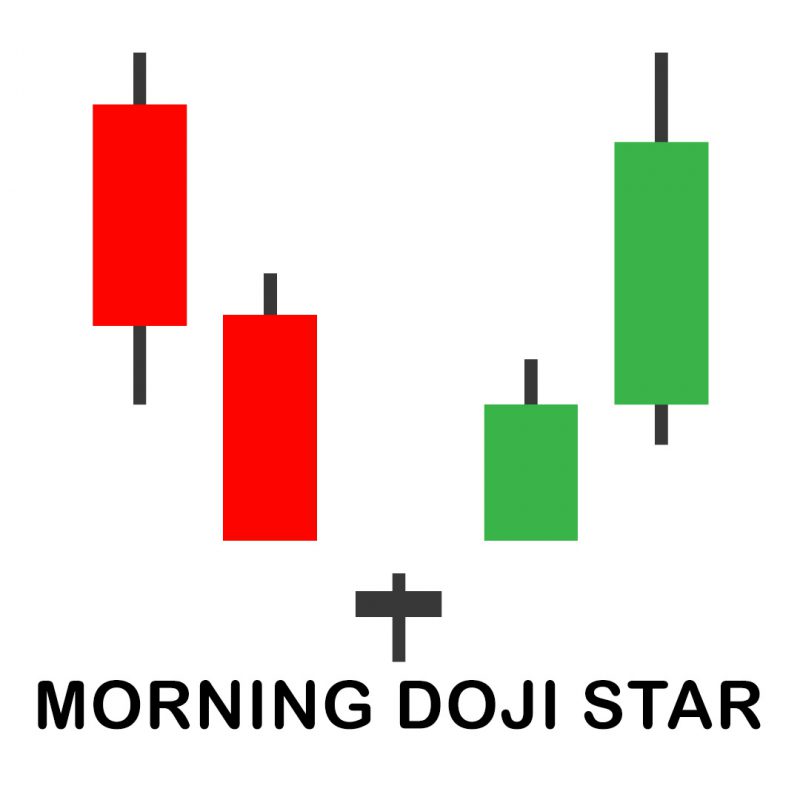
Morning Doji Star
The “Morning Star Doji”, a potent bullish reversal pattern, signifies a shift from bearish to bullish momentum, signaling the ascendancy of bulls. Evident at the chart’s bottom after a downtrend, this three-candle pattern offers a visible reversal cue. While providing a clear indication of trend reversal and a favorable risk-to-reward ratio, it has drawbacks, including the potential for false signals and a relatively prolonged development time on the price chart.
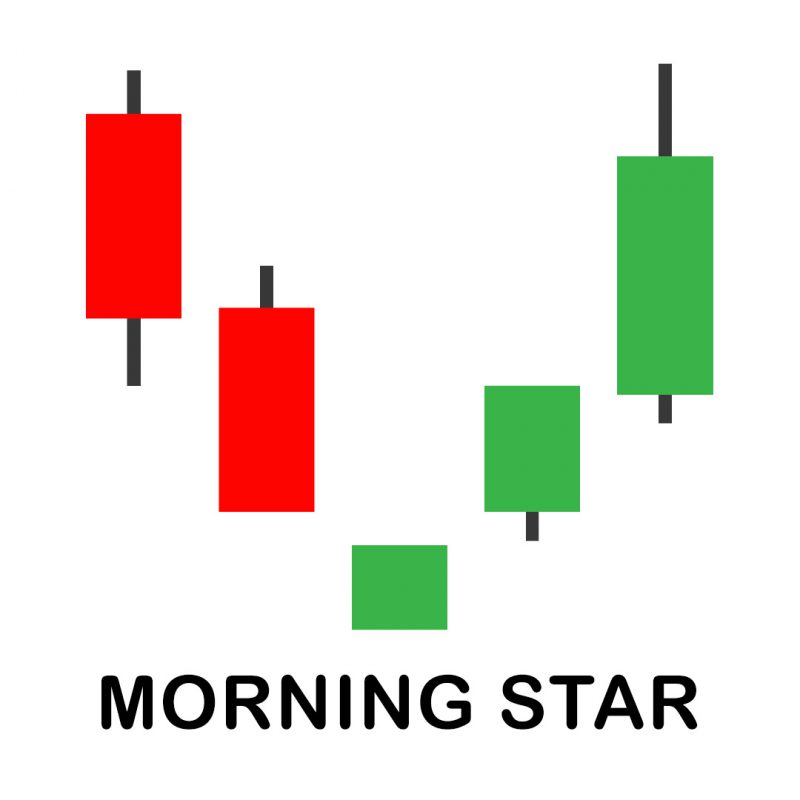
Morning Star
The “Morning Star” candlestick pattern, a robust bullish reversal signal, unfolds across three candles. Beginning with a forceful bearish candle, followed by a doji indicating market indecision and weakening sellers, it culminates in a vigorous bullish candle, signaling a trend shift. Positioned at the chart’s bottom after a downtrend, traders often employ this pattern, placing stop losses strategically. With a high probability rate and easy naked chart identification, its efficacy may be compromised by false signals, emphasizing the importance of supplementary technical tools.
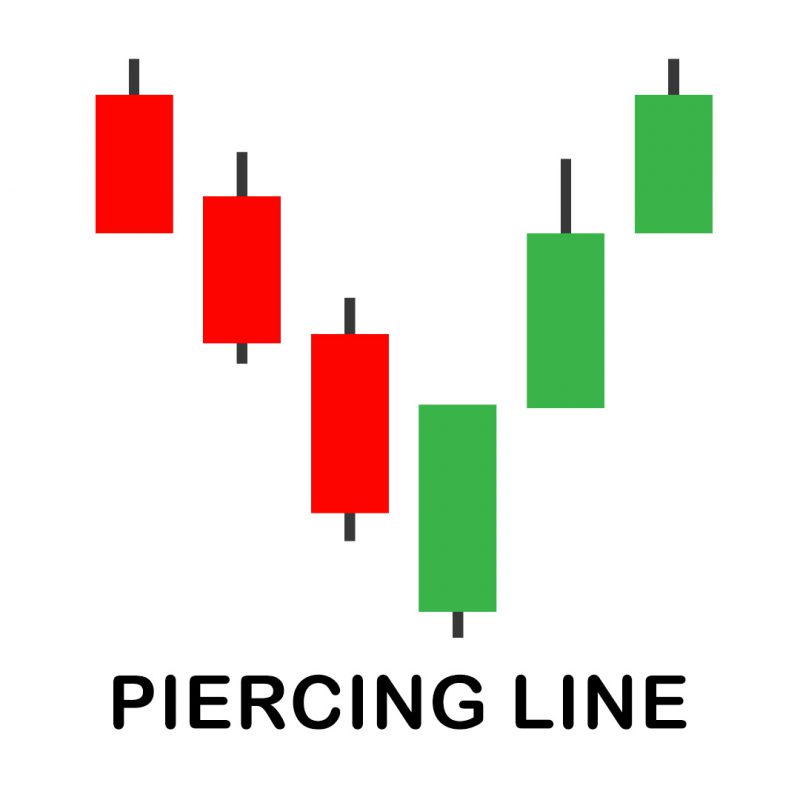
Piercing Line
The “Piercing Line” candlestick pattern signals a bullish reversal, emerging after a robust bearish candle. The subsequent bullish candle, opening below the prior day’s low but closing above its midpoint, signifies a shift to buyer dominance. Situated at the chart’s bottom, this pattern is strong and discernible on a naked chart, though its rarity and potential confusion for beginners warrant caution.
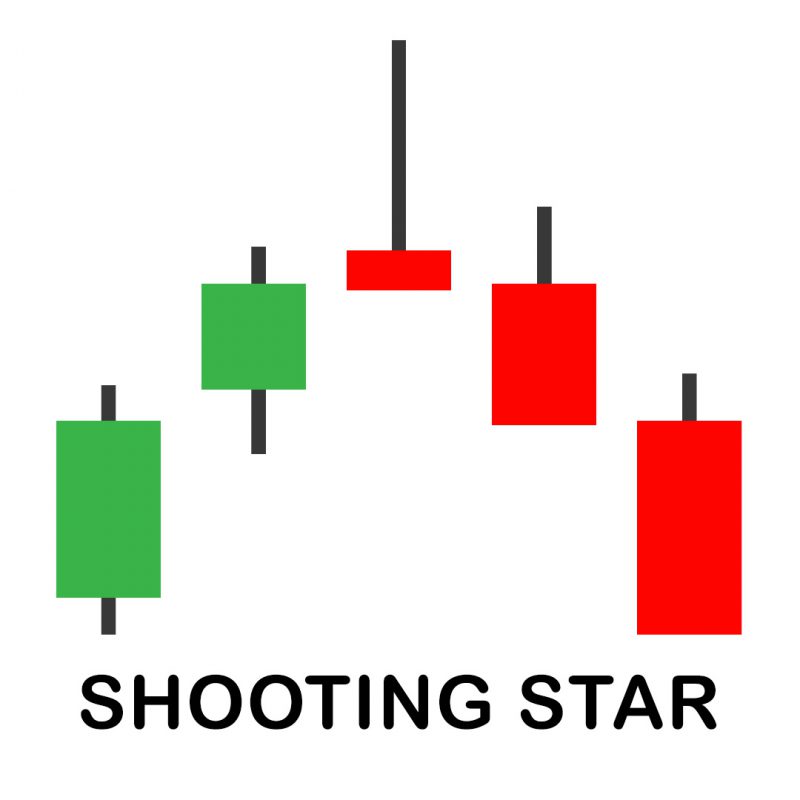
Shooting Star
The “Shooting Star” candlestick pattern, a single bearish reversal signal, features a long upper wick and a small or nonexistent body. Confirmation comes with a subsequent strong bearish candle. This pattern, found at market tops, signifies buyers losing control to sellers. Easily recognizable on a naked chart, it offers a clear indication of a potential trend reversal, allowing traders to place stop losses at the Shooting Star’s high. However, caution is advised, as it can produce false signals and may lack accuracy in sideways markets.
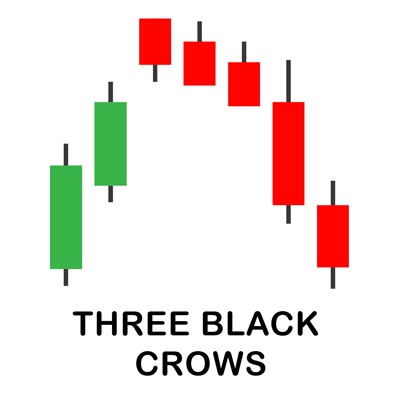
Three Black Crows
The “Three Black Crows” candlestick pattern forms at the market’s top after a bullish rally, featuring three consecutive bearish candles with lower lows. Valid when each candle opens below the previous candle’s high and closes below its low, signaling strong selling momentum. Recognizable at the chart’s peak, its clear structure facilitates easy identification. While boasting a high probability rate, it’s a rare occurrence.
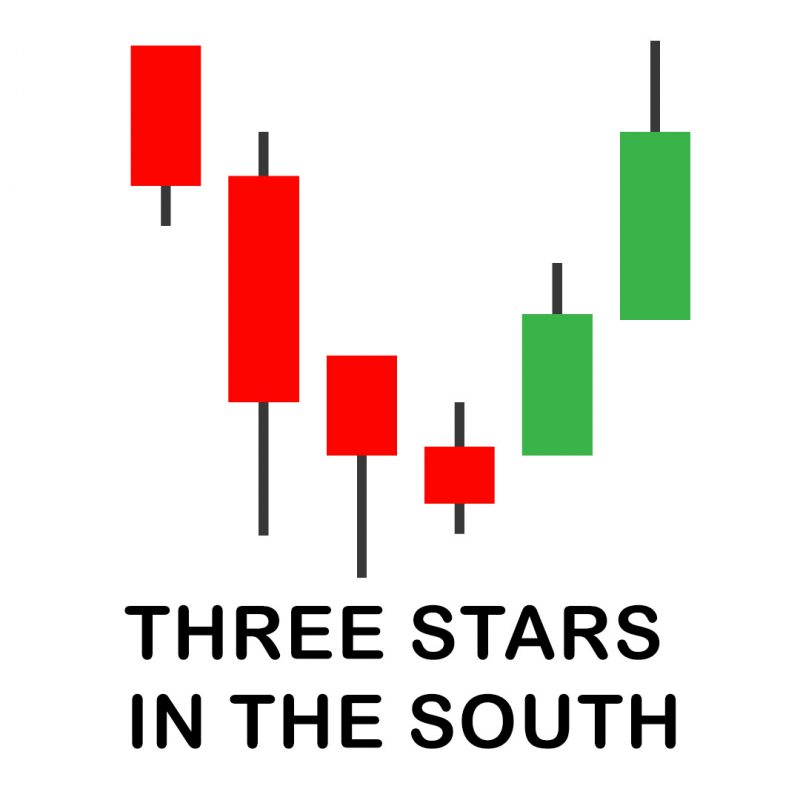
Three Stars in the South
The “Three Stars in the South” is an exceedingly rare and bullish three-candle reversal pattern on candlestick charts. Emerging after a decline, it signals a weakening bearish trend. Its characteristics include a downtrend, three black candles of decreasing size, and specific criteria for each candle’s real body and shadows. Confirmation is crucial, with a subsequent price move in the expected direction. However, its scarcity makes it challenging to find and its reversals can be modest. Traders often use additional indicators for confirmation, enhancing the reliability of this unique pattern.
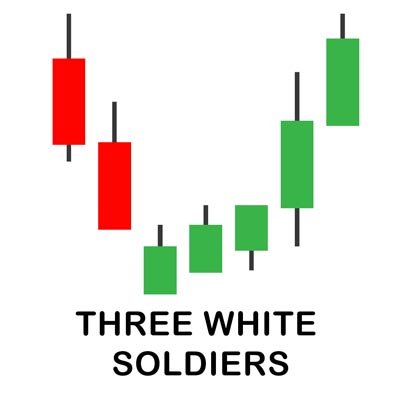
Three White Soldiers
The “Three White Soldiers” pattern on a candlestick chart is a compelling signal of potential market strength. It unfolds with three consecutive large bullish candles, each opening within the prior candle’s body and closing near its high. This sequence signifies sustained buying momentum, suggesting a potential uptrend. Recognizing such patterns is essential for astute market analysis. Dive into our educational resources to deepen your understanding of candlestick patterns and refine your trading strategies. Join us on a journey to unravel the intricacies of financial markets, enhancing your skills for informed decision-making. Learn more about our work to elevate your understanding and proficiency.
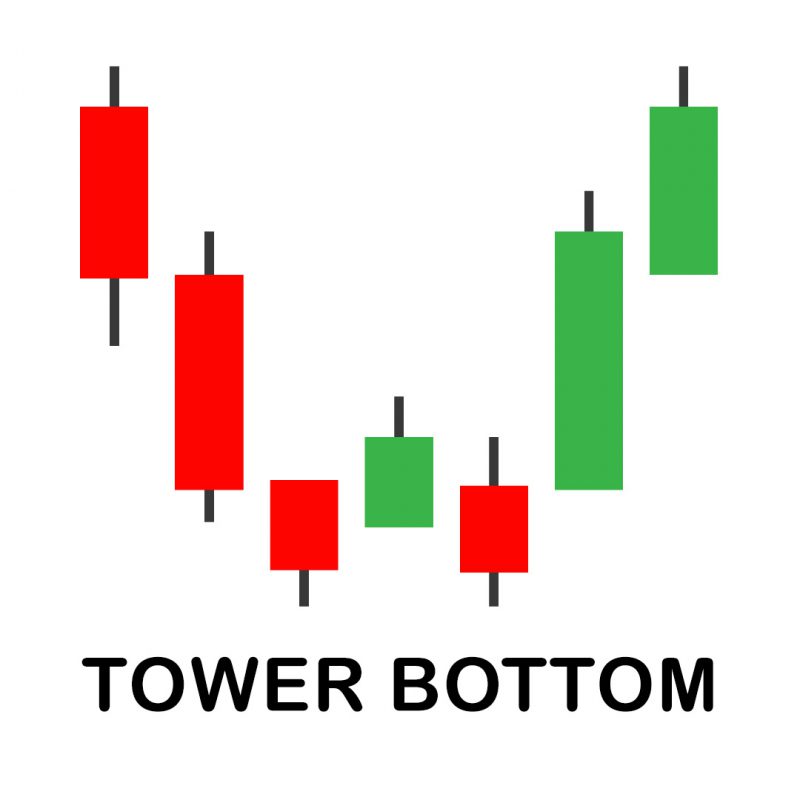
Tower Bottom
The “Tower Bottom” is a bullish trend reversal candlestick pattern marked by two significant opposite-color candles followed by three to five smaller base candles. Occurring at the chart’s bottom, it signals a gradual shift from a bearish to a bullish trend. Identifying this pattern involves a large initial bearish candle, followed by several small base candles, and concluding with a substantial bullish candle closing above the 50% Fibonacci level of the first. Reflecting supply and demand dynamics, it’s a high-probability setup. The pattern unfolds after a strong bearish trend, showcasing a battle between sellers and buyers, ultimately leading to a bullish trend reversal.
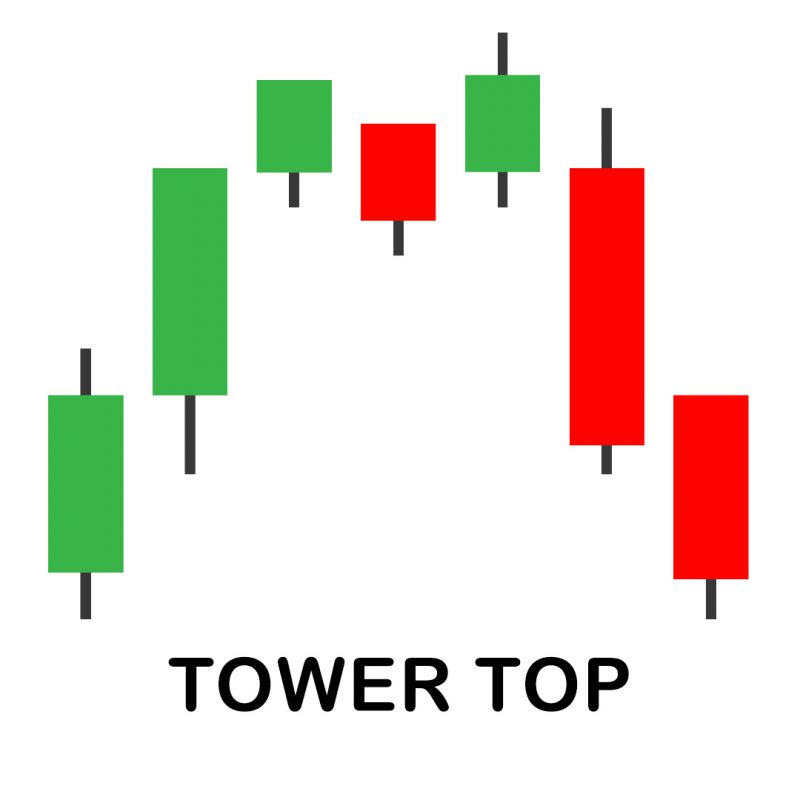
Tower Top
The “Tower Top”, a reversal candlestick pattern, emerges after a substantial uptrend marked by multiple large green candles. The bullish momentum slows, leading to a lateral price movement with smaller candles forming the top. The pattern concludes with one or more large bearish candles, symbolizing a shift from bullish to bearish control. This structure reflects a gradual exhaustion of buyers, paving the way for sellers to regain dominance. Notably, the pattern doesn’t mandate two large bearish candles for validation; even one can suffice. However, a lack of extended bearish candles invalidates the Tower Top structure.
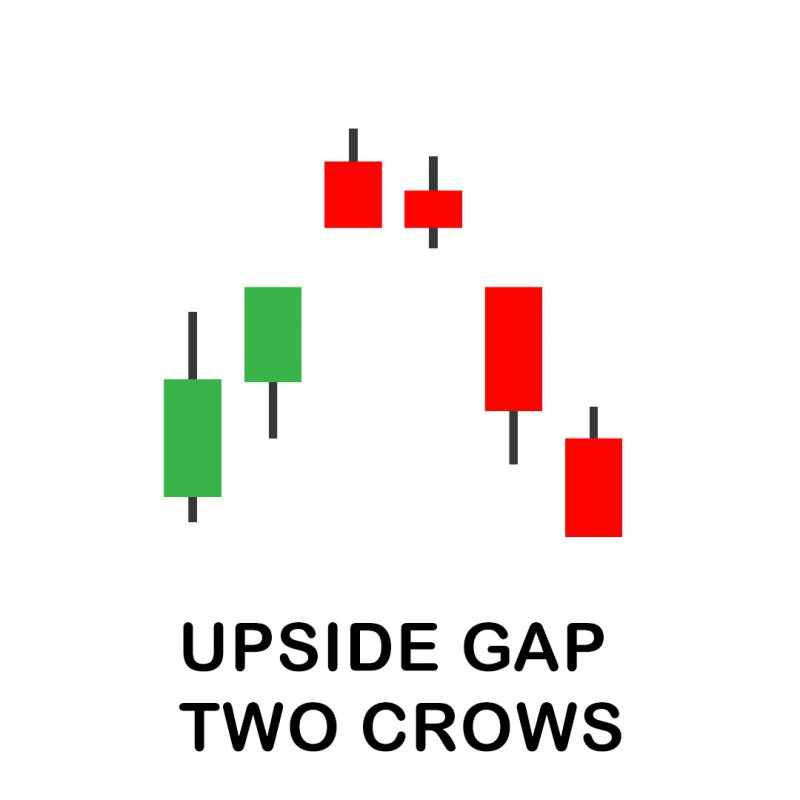
Upside Gap Two Crows
The “Upside Gap Two Crows” is a relatively uncommon three-day candlestick pattern signaling a potential reversal in an uptrend. It unfolds with a robust bullish candle, followed by a bearish one that gaps up but closes lower. The pattern concludes with a larger bearish candle engulfing the second, closing below its open and the first candle’s close. While not a guaranteed reversal, it suggests fading upward momentum. Traders may exercise caution and await confirmation, such as the price dropping below the third candle’s low before considering selling or shorting.
Conclusion
Candlestick patterns are an indispensable tool for traders, offering a dynamic and nuanced approach to market analysis. While mastering these patterns demands practice and experience, their integration into trading strategies can significantly enhance decision-making processes. Continuous learning and adaptation to market changes remain key to leveraging candlestick patterns effectively.
The information provided in the WCA Education Center does not, and is not intended to, constitute financial advice and all information, content, and materials available in the WCA Education Center are for general informational purposes only. This information may not constitute the most up-to-date information. The WCA Education Center may contain information from or links to other third-party websites. Such links are only for the convenience of the reader, user or browser; World Cup Advisor and its affiliates do not recommend or endorse the contents of any third-party sites.
Trading futures and forex involves significant risk of loss and is not suitable for everyone. Past performance is not necessarily indicative of future results.
Trading futures involves significant risk of loss and is not suitable for everyone.
Thank you for your interest in Stefano Serafini’s AutoTrade™ Trading Services. View the end-of-month Performance Reports and Account Specs for Stefano’s programs below.
Trading futures and forex involves significant risk of loss and is not suitable for everyone. Past performance is not necessarily indicative of future results.


